June 20, 2012
Extending the Bush-Era Tax Cuts: Who Gets What
A new report out today from Citizens for Tax Justice provides some interesting comparisons between the two competing approaches for extending the Bush-era tax cuts currently under debate in Washington: Congressional Republicans’ approach to extend all the Bush tax cuts and President Obama’s more limited approach of extending them only for those making less than $250,000.
Using data from the Institute on Taxation and Economic Policy, the CTJ report shows how extending the cuts will impact different income groups nationally and in Virginia. While neither proposal eliminates the Bush-era tax cuts completely – and both proposals result in tax cuts at all income levels – the different approaches result in starkly different impacts at different income levels. It boils down to this: one plan gives more generous tax cuts to the people at the very top of the income distribution, while the other spreads the tax cuts more evenly across income groups.
For example, nationally, under the plan being advanced by Congressional Republicans, 73% of all the tax cuts would go to people in the top 20% of the income distribution, with nearly a third of those (31.8%) going to people in the top 1% of the income distribution. That’s a big cut for the people at the top.
By contrast, under the plan being advanced by the President, that same group gets only 62.5% of the total cuts, and the top 1% gets just 11.4% of all the cuts. Still high; but a lot lower than the Congressional Republicans’ plan.
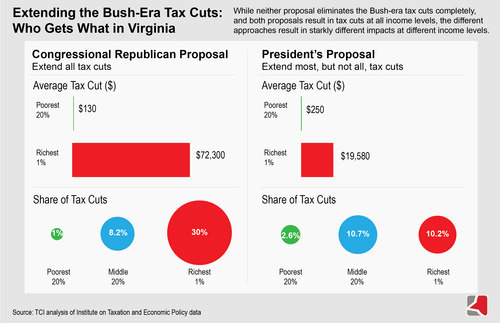
The President’s plan also spreads cuts more generously across the remaining income groups. Almost 35% of the cuts in the President’s plan go to the middle of the income distribution, where the average income is about $45,000. The Congressional Republican’s plan gives just over 25% of the cuts to this group. And at the bottom – people with the lowest income – the President’s plan gives almost 3% of the cuts, while the Congressional Republicans’ plan offers just 1%.
The CTJ report also looks at the impacts of the two proposals in each state. We took a look at the Virginia numbers, figured out who gets what and brought them together in the single graphic below.
For the full report, press release, national and state-by-state numbers, click here.