August 15, 2014
Sneak Peek: Education Funding in the Commonwealth of Virginia
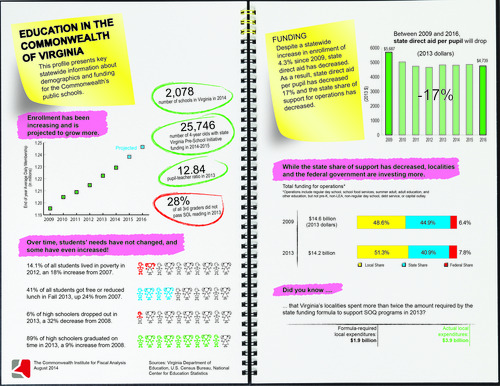
School funding per pupil is down 16 percent compared to 2009, after adjusting for inflation.
The state now covers just 41 percent of the cost for teacher salaries, building maintenance, and other school operations.
The average Virginia locality puts in 82 percent more money toward the core education costs included in the state’s standards of quality formula than is required by that funding formula.
How can all this be, when that formula is used by the state each year to calculate its share of school funding costs? Because state legislators have made a series of tweaks to reduce required state spending on K-12 education, while also reducing funding for key needs like school construction, leaving Virginia’s localities to make up the difference.
The state of education in the commonwealth is something that matters to all Virginians. The better our schools and the more our children learn, the better our economy will be in the long run.
This updated infographic (pdf) has a few key figures about K-12 education in Virginia, including school funding issues and a brief look at the needs and performance of Virginia students.
Over the next several months, we will be releasing a series of similar school division-specific infographics to provide a look at how Virginia’s schools and students are faring on a local basis.
Meanwhile, Virginians who care about the quality of their local schools should be asking their state legislators, local elected officials and school boards some tough questions about how we can all bring to the table the resources that Virginia’s kids need.
