January 12, 2024
Showing Our Work: Measures and Changes in State Support for Schools
Improving support for K-12 education to help students thrive is a widely shared goal, and understanding how to measure Virginia’s progress – or backsliding – on K-12 funding is fundamental to evaluating the merits of state policy choices. This resource explains some commonly used measures of state funding for K-12 education and examines the governor’s budget proposal by each of these measures. It also provides both nominal (not inflation-adjusted) and real (inflation-adjusted) funding levels. It’s important to consider inflation-adjusted funding levels because inflation causes school divisions to face rising costs for school supplies and everything else they buy, and also means school divisions have to pay teachers and other staff more to be able to recruit and retain qualified employees. By all measures, after adjusting for inflation, the governor’s budget proposal falls short of current funding levels. Additionally, this resource explains some of the swaps and hidden General Fund and school construction (Literary Fund) cuts in the governor’s budget proposal.
Jump to:
- K-12 distributions to school divisions
- General Fund Direct Aid for Public Education
- “Statewide totals”
- Total Funding for Direct Aid to Public Education
- Total and General Fund support in State Education Assistance Programs / State Education Programs
- How and Why the Governor’s Budget Reduces General Fund Support for Public Education
K-12 distributions to school divisions (total and per pupil)
During Virginia state budget discussions, the most widely used measures of support for public education are total and per-pupil funding as shown in the K12 Distribution Tables that are presented alongside money committee summaries of proposals from the governor, money committee budget proposals, and conference reports. Typically, these measures are available in a timely manner during budget conversations and correspond with the “State Total” data from the Virginia Department of Education’s calculation workbook’s “Final Source Data” worksheet.
Included in the total and per-pupil funding amounts are state General Fund distributions to school divisions and some non-General Fund sources such as Lottery Fund money that is distributed to school divisions. Not included in this measure are federal dollars or undistributed funding for public education, such as some construction funding, some centrally managed initiatives, and money for laboratory schools. For the 2024 budget cycle, this measure was not available for the governor’s budget proposal until early January.
Caboose proposal (FY24)
Updated projections combined with the policy choice to use increased Lottery Funds to reduce state General Fund support for schools rather than to enhance education funding (also known as supplanting), results in the governor’s revised current-year (FY24) budget including a smaller per-pupil and total distribution of funds to local school divisions than legislators approved in September.
- The governor’s budget provides an average of $8,103 per pupil, compared to the Chapter 1 budget (current law) average of $8,173 per pupil. Total funding distributed to school divisions is cut by $164 million. These per-pupil and overall amounts include some non-General Fund sources, such as Lottery Fund money, that is distributed to school divisions but do not include federal dollars or undistributed funding for public education.
Upcoming two years (FYs 25-26)
The governor’s budget proposal uses special funds to supplant state General Funds for public schools, and makes few new investments, resulting in falling General Fund support for public schools in FY25 and FY26 and decreased per-pupil state distributions to local school divisions after adjusting for inflation compared to current funding levels.
- Before considering inflation, the governor’s budget distributes $141 million less to school divisions in FY25 and $12 million less in FY26 compared to current-year funding. Per pupil, the governor’s budget distributes an average of $8,137 in FY25 and $8,260 in FY26, compared to the Chapter 1 budget (current law) average of $8,173 per pupil for the current school year (FY24). That’s a 0.4% reduction in FY25 and a 1.1% increase in FY26 in nominal terms.
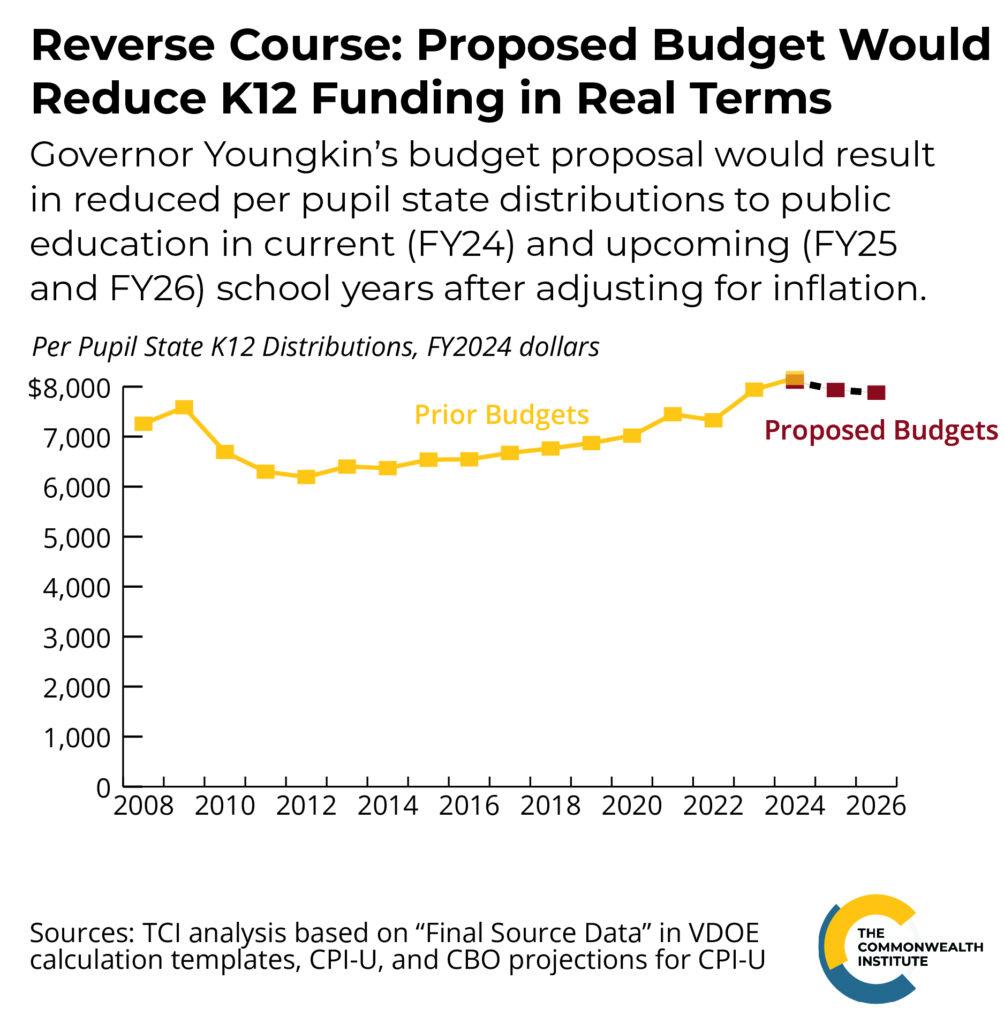
- After adjusting for inflation, the governor’s budget distributes $389 million less to school divisions in FY25 than in FY24 (in FY2024 dollars) and $472 million less in FY26 than in FY24. Per pupil, the governor’s budget distributes an average of $7,932 in FY25 and $7,880 in FY26, compared to the Chapter 1 budget (current law) average of $8,173 per pupil for the current school year (FY24).1 That’s a 2.9% reduction in FY25 and a 3.6% reduction in FY26 after adjusting for inflation.
General Fund Direct Aid for Public Education (total and per pupil)
This measure is based on funds appropriated in the state budget through the Direct Aid for Public Education budget section. The General Fund is the money over which policymakers have the most flexibility and is an important indicator of how much policymakers are prioritizing public education funding when making budget decisions. This measure only includes General Fund money but includes some funds that are not distributed to school divisions, such as some construction funding.
Caboose proposal (FY24)
Updated projections combined with the policy choice to use increased Lottery Funds to reduce state General Fund support for schools rather than to enhance education funding (also known as supplanting), results in the governor’s revised current-year (FY24) budget including less in General Fund money for Direct Aid to Public Education on both a total and per-pupil basis.
- The governor’s amended budget provides $283 million less in General Fund dollars for Direct Aid for Public Education in the current school year (FY24) than was approved in current law (Chapter 1, Acts of Assembly 2023 Special Session I). That’s a 3.1% reduction.
- Even accounting for updated (reduced) average daily membership projections, General Fund direct aid for public education is down $173 per pupil in the current school year in the governor’s budget amendments. That’s a 2.3% reduction.
Upcoming two years (FYs 25-26)
The governor’s budget proposal uses special funds to supplant state General Funds for public schools, and makes few new investments, resulting in falling General Fund support for public schools in FY25 and FY26 and decreased per-pupil General Fund appropriations to Direct Aid for Public Education.
- Before considering inflation, the governor’s budget appropriates $156 million less in FY25 and $138 million less in FY26 compared to current-year General Fund appropriations to Direct Aid for Public Education. That’s almost $300 million less across the two-year budget, and is a 1.7% reduction in FY25 and a 1.5% reduction in FY26. Per pupil, the governor’s budget appropriates to Direct Aid an average of $7,473 General Fund dollars in FY25 and $7,503 in FY26, compared to the Chapter 1 budget (current law) average of $7,528 per pupil for the current school year (FY24). Those are reductions of 0.7% in FY25 and 0.3% in FY26.
- After adjusting for inflation, the governor’s budget appropriates $384 million less in General Fund dollars to Direct Aid in FY25 than in FY24 (in FY2024 dollars) and $556 million less in FY26 than in FY24. Per pupil, the governor’s budget appropriates an average of $7,285 General Fund dollars in FY25 and $7,158 in FY26 in FY2024 dollars, compared to the Chapter 1 budget (current law) average of $7,528 per pupil for the current school year (FY24). Those are reductions of 3.2% in FY25 and 4.9% in FY26.
“Statewide totals” (total and per pupil)
“Statewide totals” from the Virginia Department of Education’s “statewide totals” sheet includes undistributed funds such as money for the College Partnership Laboratory Schools Fund, one-time Virginia Retirement System superdeposits to reduce future costs, competitive (application-based) funding for school construction, and a variety of statewide and regional programs that are not structured as appropriations to local school divisions, as well as funds that are distributed to school divisions. This statewide totals measure is not typically available as quickly as the K-12 distributions to school divisions during the budget negotiation process and includes funds over which policymakers have little flexibility.
Caboose proposal (FY24)
Updated projections combined with the policy choice to use increased Lottery Funds to reduce state General Fund support for schools rather than to enhance educational opportunities (also known as supplanting), results in the governor’s revised current-year (FY24) budget including less in state funding, as measured in the “statewide totals” in the VDOE calc sheets, on both a total and per-pupil basis.
- The governor’s budget provides an average of $8,191 per pupil, compared to the Chapter 1 budget (current law) average of $8,285 per pupil. That’s a 1.1% reduction. Total funding distributed to school divisions is cut by $194 million, which is a 1.9% reduction. These per-pupil and overall amounts include some non-General Fund sources such as Lottery Fund money that is distributed to school divisions.
Upcoming two years (FYs 25-26)
The governor’s budget proposal appropriates some available special funds, such as casino revenue for school construction, puts some additional money into college lab schools, and makes some new investments. Together, these increases offset the reductions in the governor’s budget and result in increases in “statewide totals” on a total dollar and per-pupil basis before adjusting for inflation. However, after adjusting for inflation, funding levels by this measure fall in FY26.
- Before considering inflation, the governor’s budget distributes $306 million more in FY25 and $90 million more in FY26 compared to current-year funding. Per pupil, the governor’s budget distributes an average of $8,619 in FY25 and $8,457 in FY26, compared to the Chapter 1 budget (current law) average of $8,285 per pupil for the current school year (FY24). Those are increases of 4.0% in FY25 and 2.1% in FY26.
- After adjusting for inflation, the governor’s budget distributes $44 million more in FY25 than in FY24 (in FY2024 dollars) and $381 million less in FY26 than in FY24. Per pupil, the governor’s budget distributes an average of $8,402 in FY25 and $8,068 in FY26, compared to the Chapter 1 budget (current law) average of $8,285 per pupil for the current school year (FY24). That’s an increase of 1.4% in FY25 but a decrease of 2.6% in FY26.
Total Funding for Direct Aid to Public Education
Total Funding for Direct Aid to Public Education in the budget includes federal funding, state General and special funds, and total funding for the subcategory within Direct Aid for “State Educational Assistance Programs.” This very broad measure includes federal funding over which legislators have little control.
Caboose proposal (FY24)
Updated projections combined with the policy choice to use increased Lottery Funds to reduce state General Fund support for schools rather than to enhance educational opportunities (also known as supplanting), results in the governor’s revised current-year (FY24) budget including less in total money (including state and federal funds) for Direct Aid to Public Education on both a total and per-pupil basis.
- The governor’s amended budget provides $193 million less in total dollars for Direct Aid for Public Education in the current school year (FY24) than was approved in current law (Chapter 1, Acts of Assembly 2023 Special Session I). That’s a 1.7% reduction.
- Even accounting for updated (reduced) average daily membership projections, General Fund direct aid for public education is down $87 per pupil in the current school year in the governor’s budget amendments. That’s a 1.0% reduction.
Upcoming two years (FYs 25-26)
The governor’s budget proposal appropriates some available special funds, such as casino revenue for school construction, puts some additional money into college lab schools, and makes some new investments. Together, these increases offset the reductions in the governor’s budget and increase total appropriations (state and federal) on a total dollar and per-pupil basis before adjusting for inflation. However, after adjusting for inflation, funding levels by this measure fall in FY26.
- Before considering inflation, the governor’s budget appropriates $306 million more in FY25 and $90 million more in FY26 compared to current-year total appropriations to Direct Aid for Public Education. That’s a 2.7% increase in FY25 and a 0.8% increase in FY26. Per pupil, the governor’s budget appropriates to Direct Aid an average of $9,489 total dollars in FY25 and $9,329 in FY26, compared to the Chapter 1 budget (current law) average of $9,147 per pupil for the current school year (FY24). Those are increases of 3.7% in FY25 and 2.0% in FY26.
- After adjusting for inflation, the governor’s budget appropriates $17 million more to Direct Aid in FY25 than in FY24 (in FY2024 dollars) and $430 million less in FY26 than in FY24. Per pupil, the governor’s budget appropriates an average of $9,251 total dollars in FY25 and $8,900 in FY26 in FY2024 dollars, compared to the Chapter 1 budget (current law) average of $9,147 per pupil for the current school year (FY24). That’s an increase of 0.2% in FY25 but a reduction of 3.8% in FY26.
Total and General Fund support in State Education Assistance Programs / State Education Programs (total and per pupil)
This measure is based on funds appropriated in the state budget. These budget items are subsets of the Direct Aid to Public Education section of the budget (with the related “state education programs” item appearing in Chapter 1 as a budget drafting tool), and the governor’s budget proposals have similar impacts to those described in the Direct Aid sections above. In all cases, the direction of change (increase or decrease) is the same.
How and Why the Governor’s Budget Reduces General Fund Support for Public Education
There are a number of reasons General Fund support for Direct Aid for Public Education drops in the governor’s proposal:
- The state projects that fewer students will be attending public schools. This reduces the cost of providing the same level of services to Virginia’s students. Rather than use these savings to improve programs, the governor’s budget proposes to move most of the money to other administration priorities outside K-12 education.
- (caboose bill) The administration uses increased lottery revenue as an excuse to reduce state funding, which means our students won’t have as many resources as they need, and it undermines trust in state government. This results in an $89.5 million reduction in the current budget year. People are told that they’re benefiting schools by playing the lottery, but those benefits are meaningless if lottery money replaces other state funding rather than adding to it.
- (FYs 25-26) The governor’s budget proposes to use $300 million from the state’s Literary Fund to pay a portion of regular state teacher retirement costs in addition to making a super-deposit into the Virginia Retirement System. This allows the administration to reduce state General Fund support for public education but also reduces the availability of the Literary Fund to support school construction, which is a critical, ongoing need. Rededicating the Literary Fund to school construction was a major improvement in recent years, and moving backward on school construction funding will harm Virginia’s students. House Appropriations staff project that the proposed movement of Literary Fund money to other purposes will result in no Literary Fund money being left for school construction in FY25 or FY26.
- The governor’s budget proposes to eliminate the state’s promised funding to offset the loss of sales tax revenue from groceries and personal hygiene products for schools and local governments. This pushes $229 million of costs back onto local governments and means that in low-wealth communities with less ability to make up the difference, our students will be less supported.
- The governor’s budget includes a $388 million reduction in state funding for schools across the upcoming two years due to one-time federal pandemic aid to schools in FY2022. This change, which is a cut in substantive terms, is due to a quirk in the state’s rebenchmarking formula that is meant to cover regular updates to enrollment, inflation, and technical changes. By not fixing this quirk, the proposed budget reduces state support for schools and effectively supplants federal pandemic aid.
Given the critical findings by JLARC about the need to increase support for Virginia’s students to help every student reach their potential, any available money due to increases in special funds or changes in projections should be used to improve our public schools, not as an excuse to reduce state funding for students to pay for tax breaks for wealthy individuals.
Endnote:
- This analysis uses the Congressional Budget Office’s July 2023 inflation projections of 2.6% in FY25 and 2.2% in FY26. These are their most recently available detailed projections.
