June 24, 2019
Virginia Immigrants in the Economy: Pillars of Prosperous Communities
Whether we are born here or moved here, we all value that Virginia is a great place to raise a family. Immigrants move to Virginia for many of the same reasons as people born in other areas of the United States — job opportunities, good schools, and thriving communities. And Virginia’s immigrants are critical contributors to the state’s economy and communities, adding new energy and ideas everywhere from struggling mill towns seeking a second wind to the worker-hungry tech corridors. Immigrants in Virginia today are typically well educated, long-time residents of the United States, with many becoming U.S. citizens and raising children of their own.
Part of the Community
Today there are more than one million immigrants in Virginia.1 Immigrant Virginians now make up 12.5% of the state’s overall population, slightly below the national average of 13.7%.
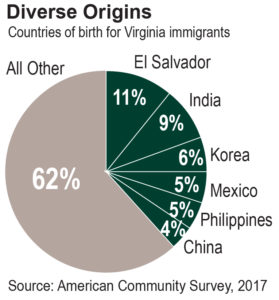
Virginia’s immigrants come from all over the world. In the national debates, immigration from Mexico tends to dominate the image of immigrants. Nationally, Mexican immigrants are indeed the biggest group, making up about 25% of all immigrants. But in Virginia, no single group dominates. Mexican immigrants make up just 5% of all immigrants in Virginia, fourth after people born in El Salvador (11%), India (9%), and Korea (6%). Looking at continent of birth, rather than country of birth, there is a similar diversity. Forty-three percent of Virginia’s immigrant population was born in Asia, the largest group from any continent.
The majority of immigrants that come to the state choose to live in Northern Virginia. Over two-thirds of the state’s immigrant population lives in Northern Virginia, making up around 27% of the total population in that region.
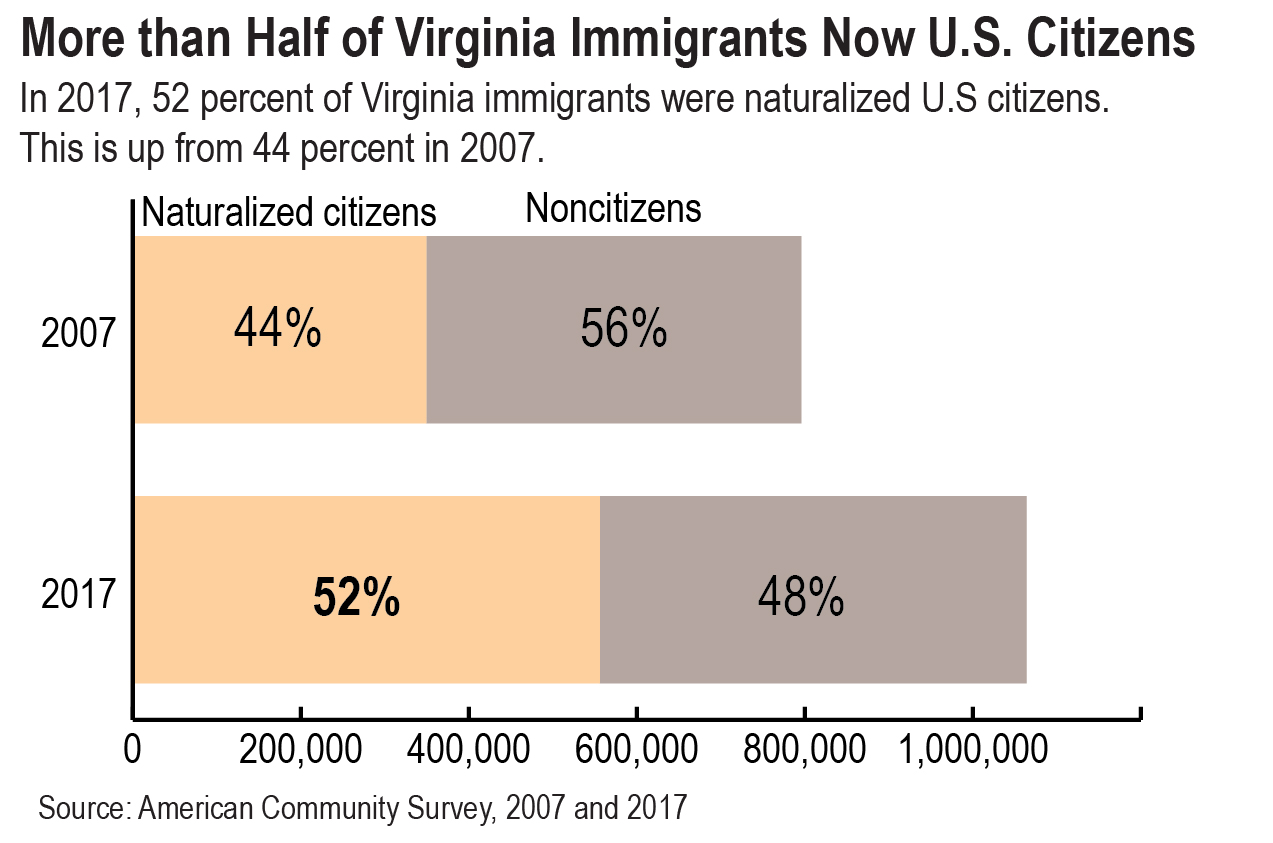
Over half of immigrants in Virginia are naturalized U.S. citizens — foreign-born residents who have lived in the United States for at least five years, applied for naturalization, and passed a citizenship test in addition to other requirements. The naturalized immigrant population in the state has grown nearly 60% in Virginia since 2007. By comparison, the state’s population of noncitizen immigrants has only grown by 14% since 2007.
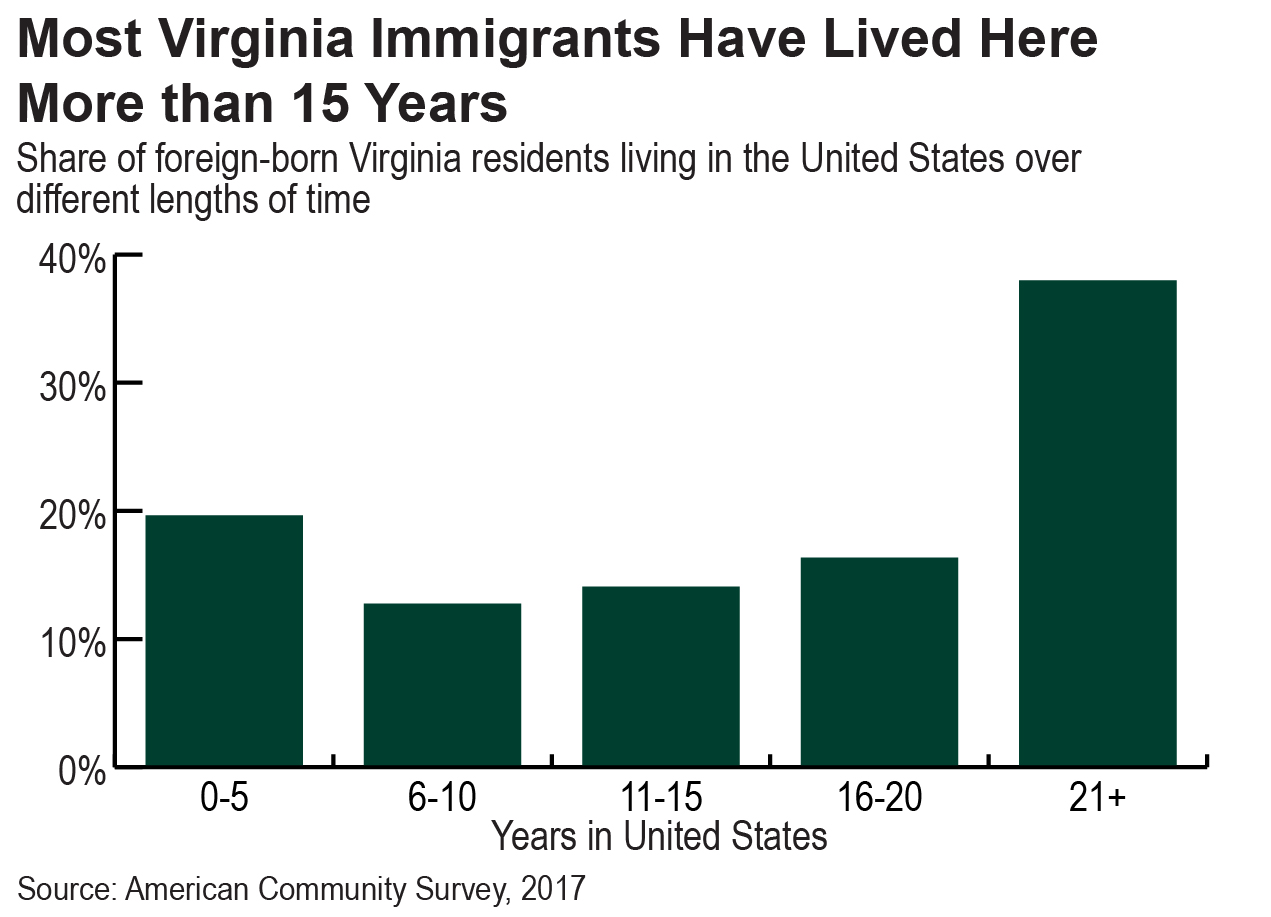
Contrary to the impression of some, most immigrants in Virginia are not newcomers to the U.S. Most of Virginia’s immigrants have been in the U.S. for a long time. Over 75% of Virginia immigrants have now been in the United States since before 2010. In fact, over half of Virginia’s immigrants have been in the United States for at least 16 years, and there is only modest variation in length of residence in the United States across race among Virginia immigrants.
And while there are few immigrant children living in Virginia, many immigrant adults have U.S.-born children who will be among tomorrow’s innovators and community leaders. In fact, almost 1 in 4 Virginia children have at least one foreign-born parent.
A Strong Immigrant Population Contributes to a Vibrant Virginia Economy
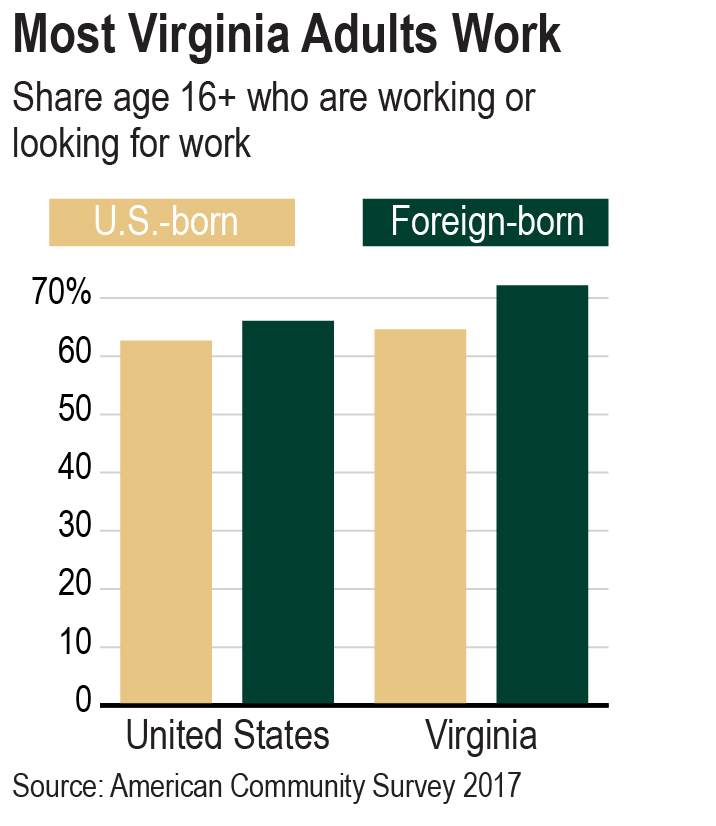
Overall, Virginia’s workforce is aging, with 24% of Virginia’s workers age 55 or older in 2018, up from 19% a decade ago and 13% two decades ago.2 It will be vital for the state to look to replace these baby-boomers with a new generation of educated and productive workers. Legislators often bemoan the fact that workforce participation within the state is lower than a decade ago,3 leaving the state vulnerable to a shrinking tax base. What is less commonly noted is the role Virginia immigrants play in supporting the labor force overall. Immigrants participate in Virginia’s workforce at a much higher rate than U.S.-born residents — 72% compared to 65% — and at a rate 6 percentage points higher than the national participation for foreign-born residents.
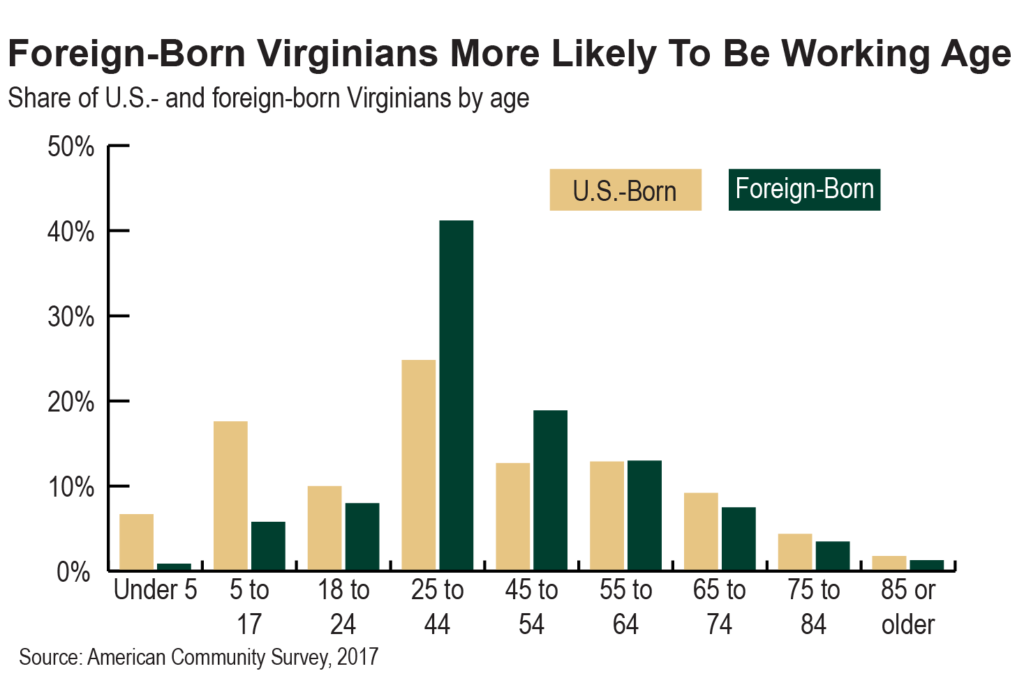
Virginia is fortunate to have among the highest immigrant workforce participation rates nationally and below average unemployment rates.4 Most immigrants in Virginia are within the prime working ages of 25 to 54, compared to a much smaller share who are children or seniors. There are strong benefits to the state’s economy from having such an age distribution. Children and seniors often require more public resources in the form of education and health care. The fact that a larger share of Virginia’s immigrant population are of prime working age, coupled with the fact that workers within the 25 to 54 age span have the highest workforce participation rates,5 means that they are making an outsized contribution to the state’s economy.
In terms of education, Virginia immigrants are more likely to hold a bachelor’s or advanced degree compared to U.S.-born residents. Of the top 10 states with the largest immigrant populations, Virginia leads in the share of foreign-born residents with a bachelor’s degree or higher. However, there are significant differences in educational attainment among immigrants. Among foreign-born Virginians age 25 or older, 59% of Asian American and Pacific Islander (AAPI) Virginians have at least a bachelor’s degree compared with 55% of non-Hispanic white Virginians, 40% of non-Hispanic Black Virginians, and 17% of Hispanic Virginians.6 People who migrate to another country tend to have higher levels of educational attainment than their home-country peers who do not emigrate.7 However, differences in the extent of this selectivity effect8 and in typical educational attainment across countries are likely driving this variation by race in educational attainment among immigrants. Diving deeper into the data, Virginians who were born in India — the most common country of origin for Virginians who identify as AAPI — have particularly high educational attainment levels, with 75% having at least a bachelor’s degree, compared with 63% of Chinese Americans, 50% of Korean Americans, and 44% of Filipino Americans.9
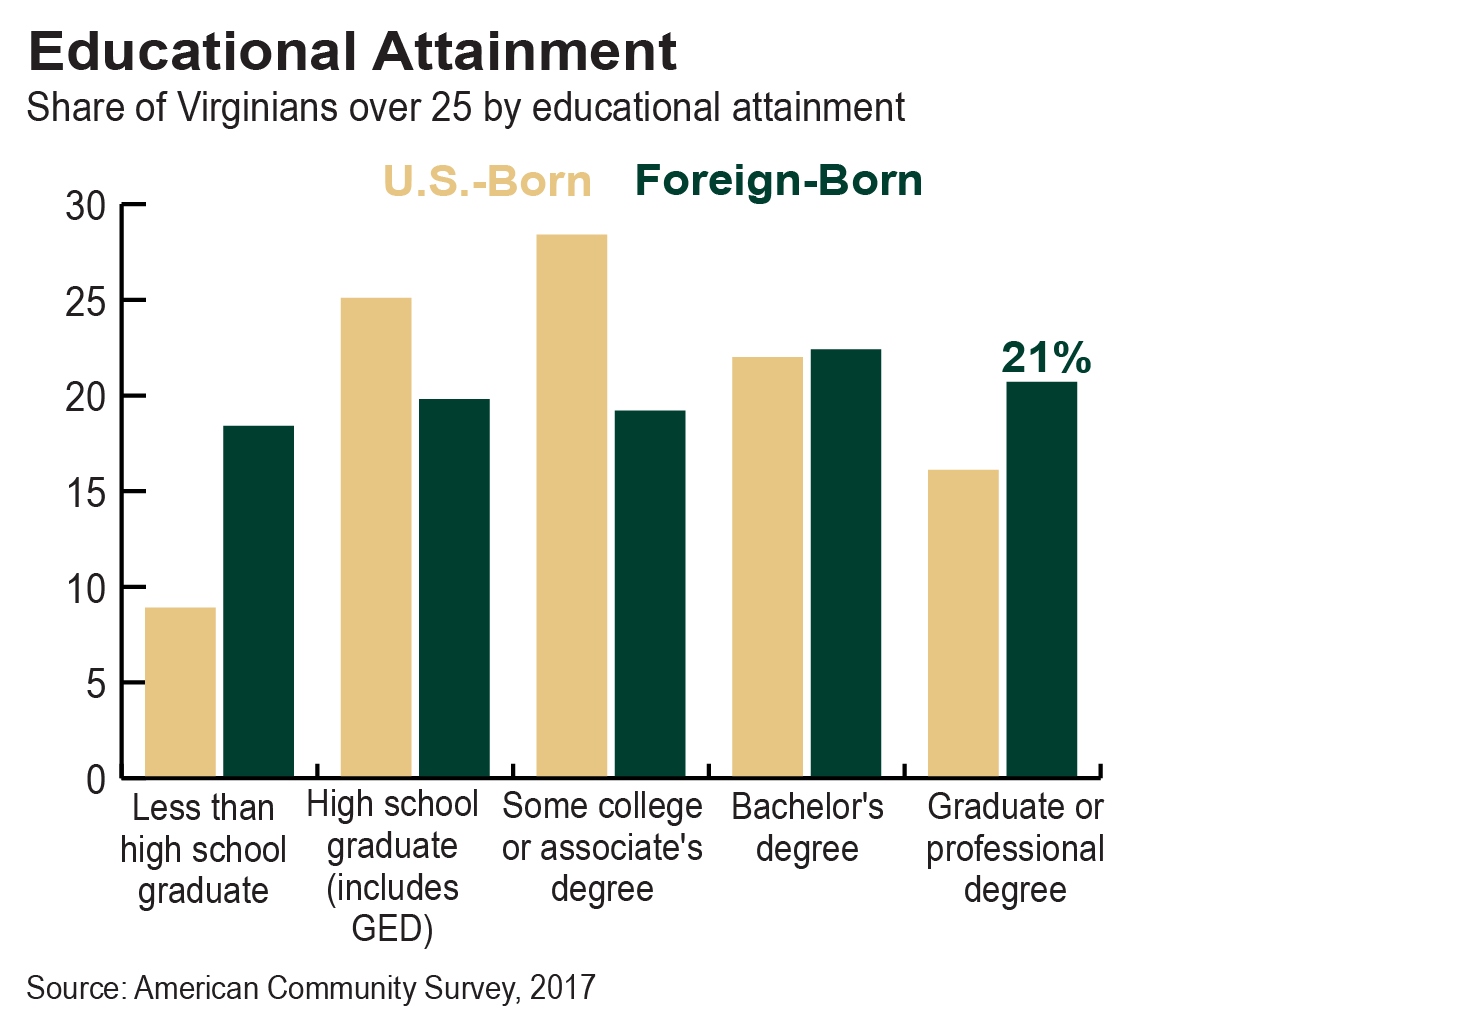
And while many immigrants are highly educated, foreign-born Virginians are also more likely than U.S.-born Virginians to have less than a high school education, driven by 4 in 10 Hispanic immigrants in Virginia not having a high school degree or equivalence.10 The children of immigrants generally have higher levels of educational attainment than their parents,11 yet special attention may need to be paid to make sure Hispanic immigrants and their children are connected with educational services that meet their needs. Additionally, removing immigration status-related barriers to accessing in-state tuition at Virginia’s public colleges and universities would make sure current students are not locked out of college affordability if their immigration status changes, help young immigrants feel confident that finishing high school will provide a realistic path to being able to attend college, and allow working adults to upgrade their skills.
Immigrants in Virginia are becoming increasingly fluent in English (meaning they speak it very well or only speak English), with 61% of immigrants over age 5 who are living in Virginia speaking English fluently. Immigrants in Virginia are significantly more likely to speak English fluently compared to all U.S. immigrants and rank eighth for most fluent out of all states.
In sum, Virginia immigrants are relatively young, well educated, fluent in English and more likely to participate in the workforce. This powerful combination reflects the substantial capacity for immigrants to fill the state’s unmet needs and contribute to the state’s economy.
Virginia’s Immigrants Work in a Variety of Occupations
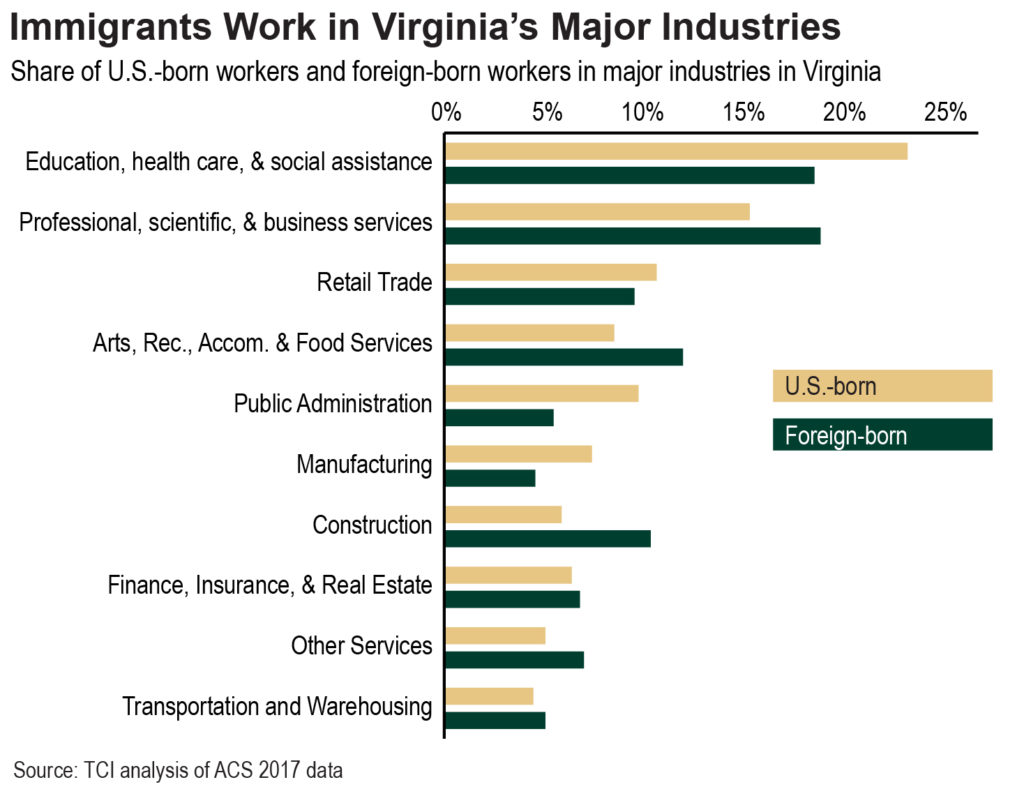
Immigrant Virginians work in a wide range of industries throughout the state. While participation rates between immigrant and U.S.-born residents are mostly similar across several industries, including retail and the finance and real estate sector, there are some areas of more pronounced difference. A greater share of U.S.-born workers are in manufacturing; education, health services, and social assistance; and public administration. Immigrant workers in Virginia are more likely to work in professional, scientific, and management jobs, as well as construction and the tourism-related arts, entertainment, accommodations, and food services industry sector.
Compared to the average employment of all foreign-born workers in the United States, Virginia’s immigrant workers are much more likely than their immigrant peers nationally to be employed in generally high-skill, high-wage sectors. Behind only D.C., the state’s immigrant population has the highest rate of employment in the professional, scientific, management, and administrative service industry. At the same time, Virginia has the second lowest rate of employment among immigrants in wholesale trade and the fifth lowest in manufacturing out of all states and D.C.
Indeed, Virginia is somewhat unique out of all states in that very little of its immigrant population works in typically “blue-collar” occupations that demand more physical labor and is moving to majority “white collar” fields. Looking at occupations, instead of industries, we see that only 20% of the state’s immigrant population works in blue-collar jobs.
Like all other states, Virginia’s immigrant workers are much less likely to work in the public sector than U.S.-born residents. Over 80% of Virginia’s immigrant workers are in the private sector compared to only 74% for U.S.-born workers. Still, immigrants living in Virginia are more likely than immigrants in the U.S. as a whole to work in the public sector, reflecting their high educational levels and the large role that the federal government plays in Virginia’s economy. Only Maryland, D.C., and New Mexico have a higher rate of public sector employment for their immigrant populations.
Business Owners and Catalysts for Economic Growth
People who move to find a better life for themselves and their families are motivated to do what they can to succeed. For immigrant Virginians, this often includes creating, owning, and operating their own businesses. Nearly 12% of Virginia’s immigrant workers were self-employed in 2017 compared to fewer than 8% of the state’s U.S.-born workers. Around 5% of Virginia’s immigrant workers are self-employed owners of incorporated businesses, compared to nearly 3% of U.S.-born workers.
Immigrants in Virginia have been the driving force for new business creation. Since 2007, the number of immigrant owners of incorporated businesses in Virginia has increased by 51%, while the number of U.S.-born business owners has decreased 4%.
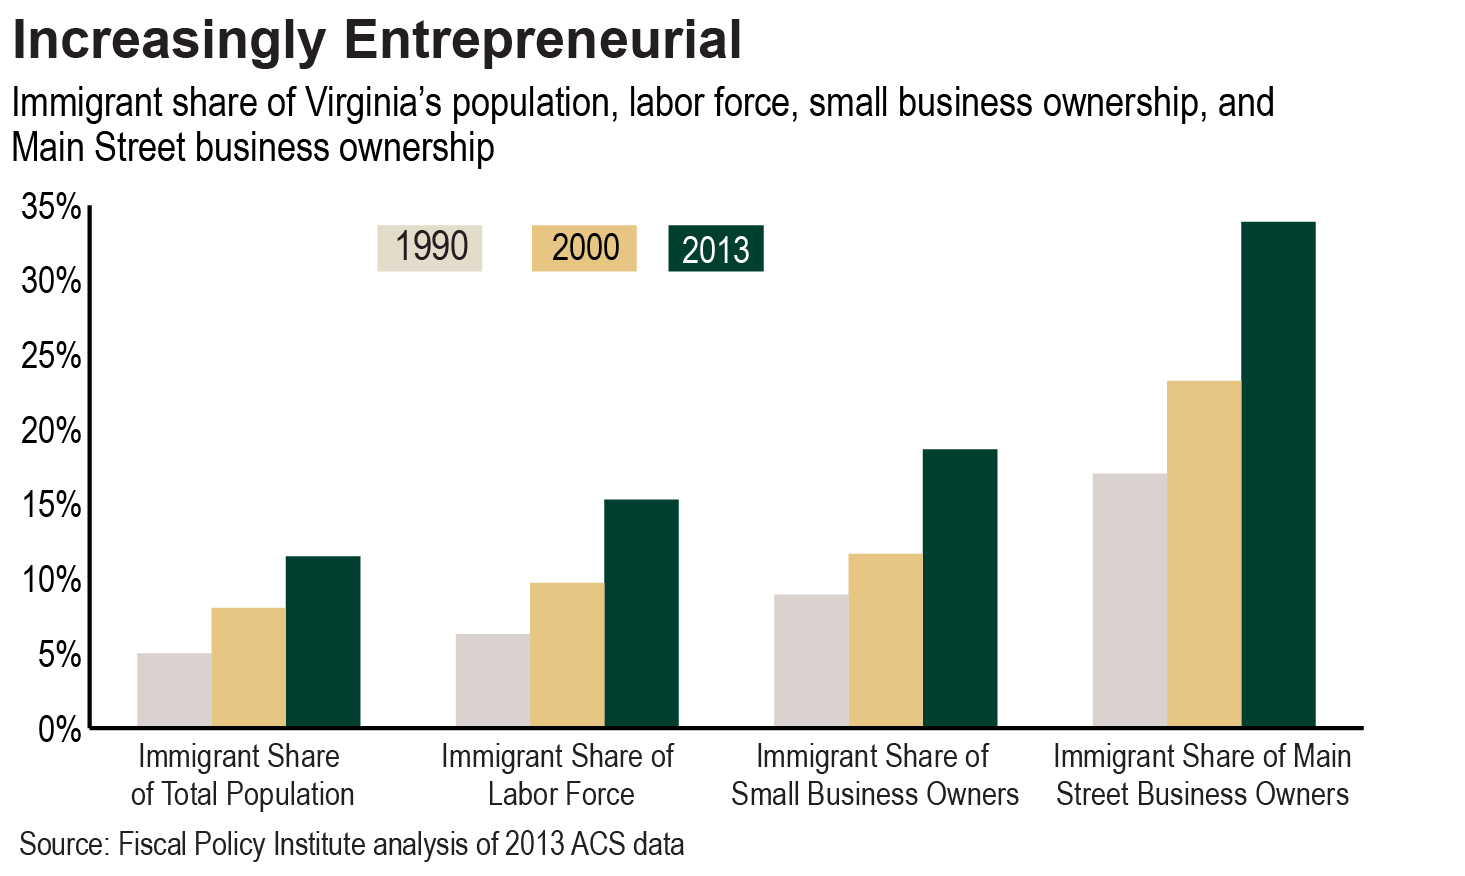
One particularly important area that Virginia immigrants contribute to is Main Street businesses — the brick and mortar establishments that we all go to on a regular basis like grocery stores, restaurants, and clothing stores. Even though Virginia immigrants only made up around 12% of the population in 2013, they constituted around 34% of all Main Street business owners, a rate that was 5% above the national average.12
Main Street businesses can have an outsized effect on local economies. A new grocery store, restaurant, or shop can provide essential community services, save residents time from traveling farther for goods, and act as a catalyst to draw in more economic activity in the area. Across the state, three-quarters of grocery stores and two-thirds of gas stations, drycleaning, and laundry services were immigrant-owned as of 2013.13
High Workforce Participation Means High Incomes Despite Lower Wages
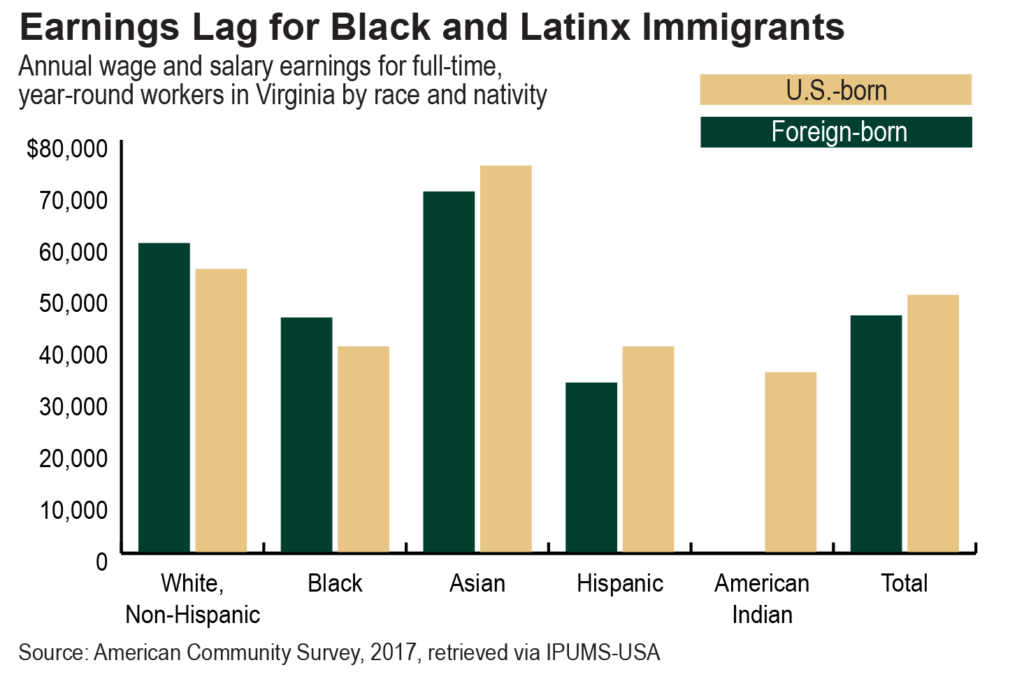
Virginia immigrants have somewhat lower wages than their U.S.-born peers, despite having somewhat higher levels of educational attainment. Among full-time, year-round workers, U.S.-born men have median earnings of $59,413, compared to $52,351 for foreign-born men, $45,989 for U.S.-born women, and $42,309 for foreign-born women. And, likely due in part to discrimination by employers, Black and Latinx immigrants who work full-time, year-round have significantly lower wages than non-Hispanic white and Asian American immigrants, just as U.S.-born Black, Latinx, and American Indian working Virginians have lower earnings than U.S.-born non-Hispanic white and Asian American workers.14
Despite bringing home less than the typical U.S.-born working Virginian, immigrants in Virginia tend to have higher wages than elsewhere in the United States. Both immigrant men and women in Virginia have the seventh highest median earnings of any state and D.C. Immigrant Virginia men and women on average earn $10,300 and $5,700 more, respectively, than immigrant counterparts in other states. While U.S.-born Virginians also make more than their U.S.-born counterparts in other states, the difference is smaller than for immigrant state residents.
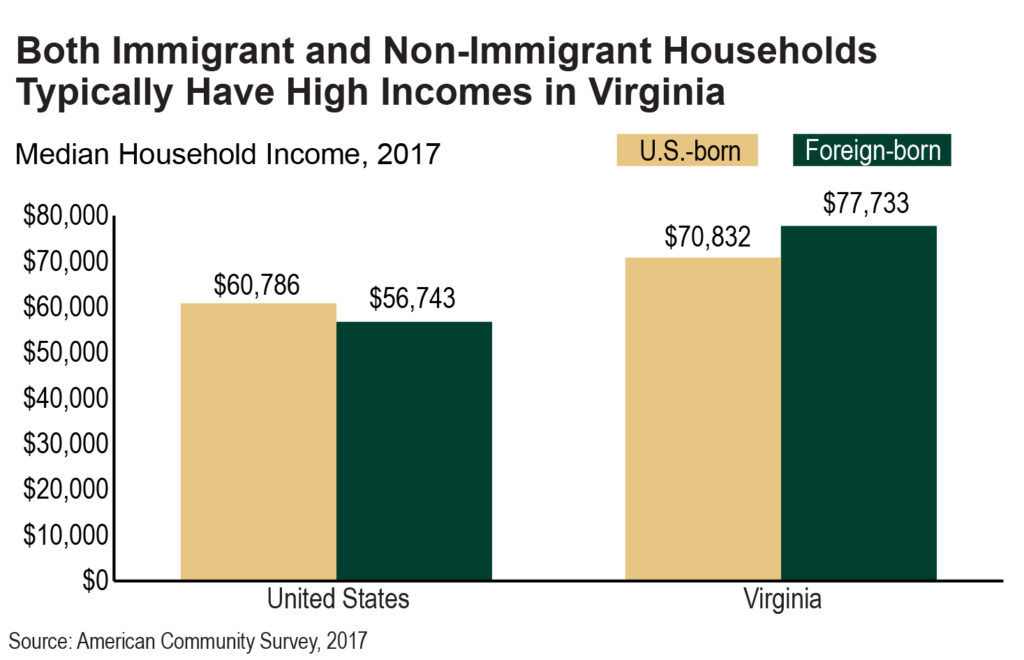
Virginia also bucks the trend nationally when it comes to household-level incomes for immigrant-headed households. High levels of employment among foreign-born Virginians mean that many households headed by immigrants are doing well despite somewhat lower wages than their U.S.-born peers. And whether foreign-born or U.S.-born, the typical household income in Virginia is higher than in the U.S. as a whole.
Looking within Virginia, while both immigrant men and women lag in personal earnings, because they have higher workforce participation rates than U.S.-born residents they tend to have higher overall household incomes. Since more immigrant Virginians are within the prime working-age, households are more likely to have two members in the workforce. In fact, immigrant households within Virginia tend to have an average of 1.71 workers per household, compared to only 1.26 for U.S.-born households. Immigrant households are also generally slightly larger than U.S.-born households, helping boost the number of working adults per household and therefore household income.
This helps push up incomes for Virginia households that are headed by immigrants. These households have a median income of $77,733, compared to $70,832 for U.S.-born households — a spread of nearly $7,000. Nationally, U.S.-born households typically have incomes that are $4,000 more than immigrant households.
Immigrants and Wages for U.S.-born Workers
A common misconception is that immigrants do not add new jobs, or that they take jobs that U.S.-born populations would work otherwise. In fact, immigrants actually create jobs directly when they start new businesses and hire employees, and indirectly when they expand the economy as consumers and investors.
Economists are in strong agreement about the role immigrants play in economic growth — more than is commonly recognized. There is also general agreement among economists that immigrants positively impact the economy, and do not reduce the wages of native-born workers over the long term.15 Adding low-skilled workers has tended to push U.S.-born workers up in the labor market, not out of it.16 And high-skilled immigration has helped make the country competitive in technology and many other areas.
There is disagreement, however, over the impact that immigration has on workers with less than a high school degree. Studies have fluctuated between slightly negative to positive for net impacts of immigration on U.S.-born workers with less than a high school degree.17 Still, there is agreement that there have been negative impacts on wages and employment for Black men with less than a high school degree.18 This is likely due at least in part to racial bias on the employers who avoid hiring Black men when other workers are available.
From a policy perspective, it would make sense to look to ways to improve working conditions and outcomes for men with less formal education, including working to combat bias in hiring, while also harnessing the overall economic gains of immigration. The alternative – restricting immigration in the hopes of protecting the wages of men with less formal education – is not a winning formula for economic growth.
Despite Success, Challenges Remain for Immigrants in Virginia That Public Policies Could Help Solve
Dismantling policy barriers could help solve low rates of health coverage
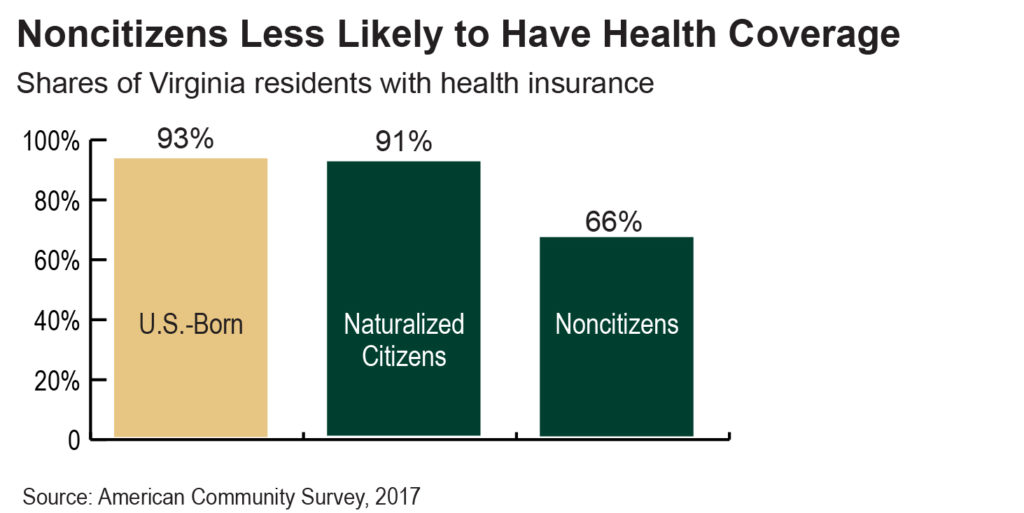
Naturalized immigrant citizens within the commonwealth have comparable health insurance coverage to the U.S.-born population. However, as of 2017, the most recent year for which data is available, Virginia has made little progress on increasing access to health care for immigrant noncitizen residents within the state. More than 1 in 3 noncitizen residents lack access to health insurance, even worse than in the country as a whole. While the national uninsured rate for noncitizens has dropped 16 percentage points since 2009, Virginia’s rate has dropped just 5 percentage points. This means that Virginia is lagging behind compared to other states in reducing the share of noncitizens who are uninsured.
When a specific segment of a population lacks health insurance, they are systematically disadvantaged — missing out on opportunities to seek preventive treatment and forced to live with conditions that may impact their work productivity or ability to maintain a job. Virginia’s delay in expanding Medicaid access within the state as a part of the Affordable Care Act, as well as the extra barriers Virginia has erected for lawfully present immigrants seeking public health insurance, has likely contributed to the state’s slower reduction in the number of uninsured residents compared to other states. A share of noncitizen immigrants — those who have had lawful permanent residency (“green cards”) for five years or longer and meet Virginia’s extra work experience requirements for noncitizens — gained access to health care through Medicaid expansion on January 1, 2019, which should reduce the share who are uninsured (2019 data will become available in 2020). However, dismantling the extra “40 quarters” work history barrier facing lawfully present immigrants, something that almost all other states have already eliminated, is another important step toward making sure everyone has access to coverage.
Raising wages and supporting families could reverse trend toward higher poverty rates for all groups
Compared to before the 2007-2009 recession, poverty rates at the state and national level have increased for U.S.- and foreign-born residents alike. However, Virginia’s poverty rate for both U.S.- and foreign-born residents remains far below the national averages. As of 2017, both U.S.- and foreign-born Virginians had poverty rates between 10 and 11%.
Virginia has moved from seventh to third as the state with the lowest share of immigrant residents living below the poverty line (less than $21,330 for a family of three) since before the recession. At the same time that Virginia is faring better than most states, there were over 115,000 immigrant state residents living below the poverty line in 2017 compared to only 79,000 in 2007. While Virginia is doing better than most, there is still progress that must be made to reverse the trend of many immigrants — as well as many U.S.-born residents — living in poverty. Not bringing home enough pay to support a family with dignity is an all-too-common challenge for both U.S.-born and immigrant families. Solutions such as increasing the minimum wage and making high-quality child care more affordable would help both immigrant and U.S.-born families who are struggling to make ends meet.
Investments in affordable housing and enforcing nondiscrimination rules could restore homeownership rates
Housing remains by far the largest expenditure for households in the United States each year.19 In 2017, housing cost an average of 18% of household income for homeowners, and renting cost an average of 30% of household income. In Virginia, 30% of immigrant and 20% of U.S.-born homeowners pay more than 30% of their income toward housing costs — a rate considered by the Department of Housing and Urban Development to make a family “housing cost burdened,” leading to “difficulty affording necessities such as food, clothing, transportation and medical care.”20 For renters in Virginia, the share of households paying more than 30% of their income for housing is even higher, at 43% for U.S.-born residents and 50% for foreign-born.
The Great Recession raised many concerns about the dangers of a housing bubble and predatory lending. Despite these very real concerns, however, homeownership is one of the most important contributors to a growing economy and a goal for most families in the United States. Immigrants are often cited as playing a critical role in driving housing demand, maintaining property values, and stabilizing neighborhoods that are in decline.21 Virginia still has higher homeownership rates than the national average, but the share of immigrant households who own their own homes has dropped substantially from 63% in 2007 to 58% in 2017.
Although the homeownership rate remains below 2007 levels, median housing prices in Virginia are up 10% (before adjusting for inflation) from their prior high in 2007,22 making it harder for first-time homebuyers to purchase a home. Meanwhile, nominal rent prices are up at least 25% across the state.23 Because immigrants are more likely to rent than U.S.-born residents, their budgets are more likely to be impacted when rent prices increase.
Given that the majority of immigrants live in the Northern Virginia region, and the fact that the median home price in the D.C. area is $408,30024 — one of the more expensive of any region in the country25 — homeownership remains out of reach for many Virginia immigrants.
Since the recession, the largest drop in homeownership in Virginia has been for noncitizen immigrant households, with just 38% of these families owning their own homes, down from 46% in 2007. Virginia’s naturalized immigrant households have also seen a drop in their homeownership rate, although both still retain a homeownership rate well above the national average.
Naturalized Virginia immigrant households have homeownership rates higher even than U.S.-born residents. These immigrants tend to have lived in the United States longer and are more likely to speak English very well than noncitizen immigrants. These skills provide naturalized immigrants with distinct advantages to accessing the housing market over noncitizen immigrants, and may explain some of the differences in homeownership.
There are a number of public policy solutions that can help make homeownership and renting more affordable and accessible for immigrant families.
There are a number of public policy solutions that can help make homeownership and renting more affordable and accessible for immigrant families. State lawmakers recently approved additional funding for the Housing Trust Fund, which provides low-cost loans for affordable rental and homeownership opportunities. Enforcing and strengthening nondiscrimination statutes will help make sure families are not turned away from a home because of their race, nationality, or immigration status. And for high-cost regions such as Northern Virginia, reducing barriers to new construction of high-density, affordable, and/or mixed-income housing could lower housing costs for both immigrant-headed and U.S.-born households.26
Clearer paths for transferring credentials and combating racial bias could reduce ‘brain waste’ effect
When someone works hard to build their skills through higher education or a credentialing program, they generally hope for more opportunities to use their newly developed talents. Unfortunately for many people, but especially immigrants in Virginia, that is not always the case. Despite high levels of educational attainment, immigrants in Virginia are less likely to work in jobs that require their level of credentials than U.S.-born residents – an effect commonly referred to as “brain waste.” Brain waste occurs when individuals have at least a college level of education and are either working in a field that does not require this credential or are unemployed.27 In Virginia, 21% of college-educated immigrants 25 and older are working in low-skill jobs or are unemployed.28 This is well above the average for U.S.-born Virginians.29 Seen another way, 1 in 9 foreign-born workers age 25 or older with a least a bachelor’s degree are working in lower-skill occupations (defined as one where fewer than half of their peers have at least 1 year of college). The same is true for just 1 in 16 U.S.-born college educated workers age 25 or older.30 Immigrants who earn their degrees abroad particularly struggle with brain waste.31 Creating clearer paths for transferring credentials earned abroad could allow Virginia’s highly educated immigrants to more fully participate in and contribute to the state’s workforce. However, rates of brain waste are also particularly high for Black and Latinx Virginia immigrants with at least a bachelor’s degree, pointing to the possibility that discrimination or other barriers that particularly impact Black and Brown communities is causing part of this brain waste.32 When immigrants in Virginia are not using the full array of their talents, the state loses out on its full creative potential. Lawmakers, employers, and workforce development officials all have a role to play in reducing this needless inefficiency and maximizing opportunity for the state.
Removing immigration-related barriers to Virginia’s driver’s license training, testing, and licensing system could improve safety and reduce stress
While many immigrant Virginians are able to access Virginia’s system of driver’s license training, testing, and licensing, some foreign-born Virginians do not have the specific types of immigrant status that are currently required for obtaining a Virginia driver’s license. Removing barriers to lawfully driving that are unrelated to road safety would make Virginia’s roads safer by increasing the number of people who go through Virginia’s driver’s license training and testing system and allow parents to get to church or their child’s school without fear of being arrested for driving without a license.
Most Virginia Immigrants Well-Versed in English; Could Do Even Better with Targeted Support
Moving to a new place, whether a new state or a new country, can be challenging at first, and for many immigrants coming to the United States means needing to navigate a new language as well as a new culture. Virginia’s share of immigrants who speak English “very well” has increased since before the recession. Seven in ten naturalized immigrants now speak English very well, as do half of noncitizen immigrants. However, new immigrants who are not yet naturalized citizens, most of whom are young working-age adults, may never receive English-language services unless they are provided through a community or nonprofit agency. Lack of access to these services poses substantial barriers for many newer immigrants in accessing the job market and post-secondary education. Public support for English-language training could help dismantle this barrier and help every Virginian be able to fully use their skills to contribute to the commonwealth.
Lack of language access impacts the children of immigrants as well as immigrants themselves. Although most children of immigrants live in a household where at least one adult or older teen speaks English at least very well, there are about 47,000 school-age children in Virginia with no household member age 14 or older who speaks English at least very well. And currently the state has nearly 108,000 students classified by their schools as limited English proficient — up 39% since the start of the recession.33 The number of students identified as limited English proficient tends to be higher in elementary grades and declines as students move through school. Less than 4,000 high school seniors were classified as limited English proficient in Virginia as of fall 2018, compared to more than 13,000 kindergartners.34 Making sure schools have the resources and expertise to provide high-quality education to every child, no matter what language they speak when entering kindergarten, will be critical for making sure tomorrow’s parents and community leaders are prepared to succeed and create an even better life for their children.
Unique Challenges Facing Unauthorized and Mixed-Status Commonwealth Families
The majority of Virginia’s immigrant population are legally present in the United States. Nationally, the number of unauthorized immigrants in the U.S. decreased by 1.5 million people between 2007 and 2016.35 Much of this decline has been from fewer unauthorized immigrants, particularly fewer Mexicans, entering the country,36 a trend that likely had less impact in Virginia than in border states. As of 2016, Virginia had an estimated 269,000 to 275,000 unauthorized immigrant residents, representing a diverse group from all over the world, according to estimates by the Pew Research Center and Migration Policy Institute.37 That is statistically unchanged from 2007 levels, according to Pew analysis.38 The largest share of Virginia’s unauthorized immigrant population comes from El Salvador (21%),39 a country that experienced a civil war lasting more than a decade and continues to experience high levels of violence, leading to families fleeing to safer countries.
As with immigrants overall, in Virginia unauthorized immigrants have lived in the U.S. for a long time. An estimated 3 out of 4 unauthorized immigrants in Virginia have been in the United States for over five years.40
Many unauthorized immigrants have had families or married since they arrived. More than a quarter of unauthorized immigrant Virginians live with a child under 18 who is a U.S. citizen.41 This number does not account for unauthorized immigrants who have children who are citizens not living with them. Additionally, around 18% of unauthorized immigrant Virginians are married to a U.S. citizen or legal permanent resident.42
Unauthorized immigrants have very high labor force participation rates – higher even than immigrants overall. Around 75% of unauthorized Virginians participate in the labor force,43 well above the 65% rate for the state’s U.S.-born population.44 Unauthorized immigrants over 16 years of age represented only 3.4% of Virginia’s overall population in 2016, yet constituted 4.7% of the workforce.45
Each year, unauthorized immigrants in Virginia pay more than $250 million in state and local taxes.46 And were unauthorized immigrants offered a path to citizenship, their contribution would increase by an estimated $100 million in additional state and local taxes on an annual basis through increased tax compliance.47 On the other hand, should young adult Virginians who entered the United States as children lose deferred action (DACA) status, state and local tax revenue would likely drop by $11 million per year.48
When it comes to post-secondary education, Virginia’s unauthorized immigrants are not far behind the U.S.-born population. Nearly 40% of unauthorized immigrants have attained at least some college or an associate’s degree.49 And of this group, a majority have earned a bachelor’s, graduate, or professional degree.50
Some of Virginia’s 269,000 to 275,000 unauthorized immigrants have been offered temporary protection from deportation. Nationally, around 7% of unauthorized immigrants have successfully applied for the Deferred Action for Childhood Arrivals program and maintained their status at least through August 2018, including over 10,000 young Virginians.51 This program provides temporary protection from deportation to unauthorized immigrants who came to the country as children, have little to no criminal records, and are seeking post-secondary education or have completed a high school equivalent of education. These estimates of unauthorized immigrants also include over 28,000 Virginians who have been granted Temporary Protected Status (TPS) due to threats from returning to their home countries.52 These protections are particularly significant for Virginia’s large Salvadoran-American community: TPS was created by the U.S. Congress in 1990 and protections were extended to people from El Salvador as part of that law. Nationally, Salvadorans continue to make up 60% of all TPS holders. However, these protections are now at risk — there is ongoing litigation over plans to terminate TPS for people from Sudan, Nicaragua, Haiti, and El Salvador.53
While unauthorized immigrants are major contributors to the state’s economy, they continue to face numerous challenges.
While unauthorized immigrants are major contributors to the state’s economy, they continue to face numerous challenges. Nearly 1 out of 5 live below the poverty line and half lack health insurance54 — these are both well above the U.S.-born rates.
In addition to the slew of challenges posed by not having health insurance and being more likely to be living below the poverty line, hate crimes toward immigrant groups have been on the rise in the United States over the last few years.55 Some hatewatch groups have cited charged political rhetoric and unsubstantiated statements about the threats posed by immigrants as contributing factors to increases in intimidation and discrimination.56 Experiences interacting with immigrants do not seem to be the cause of hate crimes – when more people interact with immigrants as neighbors, co-workers, and community members, they tend to have more positive feelings for the group. States that have higher concentrations of immigrants have been shown to be correlated with fewer hate groups per capita.57
Children of immigrants are particularly affected by charged discriminatory rhetoric. Many of these children live in fear of their parents being detained, arrested, or deported. An estimated 90,000 immigrant parents of U.S.-citizen children were deported each year between 2010 and 2012.58 Deportation of parents has been shown to lead to higher rates of anxiety, depression, and post-traumatic stress disorder among the remaining family members.59 Additionally, median income for these households on average drops below the poverty line from $36,000 to $15,400 when a family member is deported, and health conditions for the remaining family members also decline.60 With so many additional stressors, children who come from households where parents are under threat of deportation are more likely to struggle in school, have lower literacy rates in adulthood, and have difficulty finding employment.61
In addition, many unauthorized immigrants have lived here for more than a decade, married citizens, had children, and pay taxes. Despite their contributions, however, unauthorized immigrants are not offered the same level of social services offered to other state residents.62 Lack of access to health care and threats of deportation and discrimination all make unauthorized immigrants and their families less able to contribute to the communities in which they live. And when unauthorized immigrants are treated like non-members of their communities, they are much more likely to be impacted by mental illness and economic hardship.
Conclusion
Virginia’s immigrants are key contributors to the state’s growth and prosperity. A majority of these immigrants are U.S. citizens and have lived in the country for more than 10 years. Yet despite how well Virginia’s immigrants have integrated, there are still many challenges that face immigrant communities. Health insurance access, discrimination, language barriers, “brain waste,” and housing costs all pose unique challenges for immigrants – particularly noncitizen immigrants. Fully tapping into the potential of this highly educated and largely working-age population will mean moving at the state and local level to break down barriers and better integrate immigrants into Virginia’s communities and economy.
Endnotes
- Except where noted, all data is from the U.S. Census Bureau, American Community Survey, 2017
- Economic Policy Institute analysis of Current Population Survey data
- Ibid
- Bureau of Labor Statistics, Local Area Unemployment Statistics, 2018 annual averages
- ACS data retrieved via IPUMS USA, University of Minnesota, www.ipums.org
- Ibid.
- Felicianoa, C. and Lanuzaa, Y.R., “An Immigrant Paradox? Contextual Attainment and Intergenerational Educational Mobility,” American Sociological Review, 2017
- Felicianoa, C., “Does Selective Migration Matter? Explaining Ethnic Disparities in Educational Attainment among Immigrants’ Children,” IMR, 2005
- ACS data retrieved via IPUMS USA, University of Minnesota, www.ipums.org
- Ibid.
- Felicianoa, C., “Does Selective Migration Matter? Explaining Ethnic Disparities in Educational Attainment among Immigrants’ Children,” IMR, 2005
- Fiscal Policy Institute analysis of 1990 Census, 2000 Census, and 2013 American Community Survey (ACS) data
- Ibid.
- ACS data retrieved via IPUMS USA, University of Minnesota, www.ipums.org
- Penn Wharton Background Paper, “The Effects of Immigration on the United States’ Economy — Penn Wharton Budget Model,” 2016
- Shierholz, H., “Immigration and Wages: Methodological advancements confirm modest gains for native workers,” 2010
- Penn Wharton Background Paper, “The Effects of Immigration on the United States’ Economy — Penn Wharton Budget Model,” 2016
- Borjas, G.J., Grogger, J., and Hanson, G.H., “Immigration and the Economic Status of African American Men,” 2008
- Bureau of Labor Statistics Consumer Expenditure Survey
- U.S. Dept of Housing and Urban Development (HUD), Office of Community Planning and Development, “Affordable Housing”
- New American Economy, “Immigrants Boost U.S. Economic Vitality through the Housing Market”
- Federal Housing Finance Agency, House Price Index (Purchase Only), retrieved Spring 2019
- HUD Fair Market Rent data
- Zillow Metro Housing Index (All Homes)
- Ibid.
- Washington Post, “Lack of inventory pushes up home prices in Northern Virginia,” April 2016
- Migration Policy Institute and National Center on Immigrant Integration Policy, “Brain Waste in the U.S. Workforce: Select Labor Force Characteristics of College-Educated Native-Born and Foreign-Born Adults,” 2014
- Migration Policy Institute, “Brain Waste in the Workforce: Select U.S. and State Characteristics of College-Educated Native-Born and Immigrant Adults,” 2014
- Migration Policy Institute and National Center on Immigrant Integration Policy, “Brain Waste in the U.S. Workforce: Select Labor Force Characteristics of College-Educated Native-Born and Foreign-Born Adults,” 2014
- ACS data retrieved via IPUMS USA, University of Minnesota, www.ipums.org
- Migration Policy Institute and National Center on Immigrant Integration Policy, “Brain Waste in the U.S. Workforce: Select Labor Force Characteristics of College-Educated Native-Born and Foreign-Born Adults,” 2014
- ACS data retrieved via IPUMS USA, University of Minnesota, www.ipums.org
- Virginia Department of Education Fall Membership Statistics
- Ibid.
- Pew Research Center, “U.S. Unauthorized Immigrant Total Dips to Lowest Level in a Decade,” 2018
- Ibid.
- Estimates from the Migration Policy Institute and Pew Research Center, retrieved Spring 2019
- Pew Research Center, “U.S. Unauthorized Immigrant Total Dips to Lowest Level in a Decade,” 2018
- Migration Policy Institute, “Profile of the Unauthorized Population: Virginia,” retrieved Spring 2019
- Ibid.
- Ibid.
- Ibid.
- Ibid.
- Ibid.
- Pew Research Center, “U.S. unauthorized immigrant population estimates by state, 2016”
- Institute on Taxation and Economic Policy (ITEP), “Undocumented Immigrants’ State & Local Tax Contributions,” 2017
- Ibid.
- ITEP, “State & Local Tax Contributions of Young Undocumented Immigrants,” 2018
- Migration Policy Institute, “Profile of the Unauthorized Population: Virginia,” retrieved Spring 2019
- Ibid.
- USCIS, “Approximate Active DACA Recipients: State or Territory of Residence As of August 31, 2018”
- Congressional Research Service, “Temporary Protected Status: Overview and Current Issues,” 2019
- USCIS, “Temporary Protected Status Designated Country: El Salvador,” retrieved Spring 2019
- Migration Policy Institute, “Profile of the Unauthorized Population: Virginia,” retrieved Spring 2019
- American Bar Association, “Midyear 2019: Why are hate crimes rising?,” 2019
- New York Times, “Reports of Bias-Based Attacks Tick Upward After Election,” 2016, and “U.S. Hate Crimes Surge 6%, Fueled by Attacks on Muslims,” 2016
- The Atlantic, “The Geography of Hate,” 2011
- Inter-American Human Rights Court report, “The Psychosocial Impact of Detention and Deportation on U.S. Migrant Children and Families,” 2013
- Human Impact Partners, “Family Unity, Family Health: How Family-Focused Immigration Reform Will Mean Better Health for Children and Families,” 2013
- Ibid.
- Ibid.
- Center for American Progress, “Immigrants Are Makers, Not Takers,” 2013