August 4, 2017
Let’s Take a Look at Where Government Aid is Really Going
Millions of Americans continue to take advantage of a type of federal assistance that in 2015 cost the public over $1 trillion – more than federal spending for Medicare and Medicaid combined. And a close look at the 10 largest of these aid programs shows that over half the benefit went to just 20 percent of U.S. households.
Who is this group? It’s the powerful folks who can get politicians to respond to their interests – the top 20 percent of households by income level – not families who are struggling to stay afloat. It’s time for state and federal lawmakers to take a balanced look at where public aid is directed and whether or not it helps communities and families thrive.
Double Standard
Enrollees of programs that are considered to be entitlement programs, such as Medicaid, Social Security Disability Insurance, and the Supplemental Nutrition Assistance Program, are often portrayed as undeserving. So why is this criticism not extended to those who are receiving benefits on the other end of the income spectrum?
The federal Office of Management and Budget produces estimates of revenue lost due to tax breaks – deductions, exemptions, credits, and preferential tax rates. These tax handouts have many similarities to entitlement programs, in that “any person or entity that meets the requirements for them can receive the benefits,” according to the Congressional Budget Office. But unlike disability insurance and nutrition assistance, which are constantly being tweaked to be more efficient and to ensure only those eligible receive benefits, very few ask whether or not high-income earners deserve to take advantage of lucrative tax breaks and loopholes, let alone whether or not they need it.
And the criticisms and allegations leveled at low-income recipients have not been supported by the facts. Studies show that 80 percent of SNAP participants are working or are elderly, children, or disabled. Additionally, 78 percent of working-age Medicaid recipients (without Social Security Insurance) are in a working family, and 59 percent work themselves. And, these programs are efficient. SNAP has a low net loss, with only 1 percent of benefits paid to those who are not eligible. The overpayment rate for disability insurance is only about 1 in every 100 dollars that goes to disabled adults, a lower error rate than in 2011.
There are many benefits going to the rich that low-income families typically don’t have access to. In 2014, non-farm sole proprietorships alone wrote off $9.5 billion in meal and entertainment expenses. An even more costly break is the lower tax rate on income from wealth. As one’s income increases, generally so does the share of that income coming from investments. Wealthy individuals benefit from a tax rate on capital gains that is significantly lower than the marginal tax rate on income earned from working. The federal Joint Committee on Taxation estimates that this reduced tax rate will divert $677 billion away from the federal budget between 2016-2020.
For that same time frame, the mortgage interest deduction is estimated to cost over $357 billion. In 2012, over three-quarters of those who benefited from this deduction had incomes over $100,000. Have a yacht or a second home? Those can qualify for the deduction as well. Last year, the Congressional Budget Office again suggested converting this deduction to a 15 percent credit to decrease the federal deficit, but that idea has gained little traction among legislators.
While there have been few reforms of tax expenditures that benefit the wealthy and powerful, federal lawmakers have fundamentally weakened the safety net for low-income families with children. Converting the Aid to Families with Dependent Children entitlement program to the Temporary Assistance for Needy Families block grant program – justified by exaggerating and misrepresenting examples of fraud – drastically reduced vital support for low-income families and their children. The latest House proposals threaten even more cuts to services for low-income families, while at the same time pushing tax cuts and other changes that would cost trillions of dollars over the next 10 years. That would result in new opportunities of tax avoidance for high-income individuals.
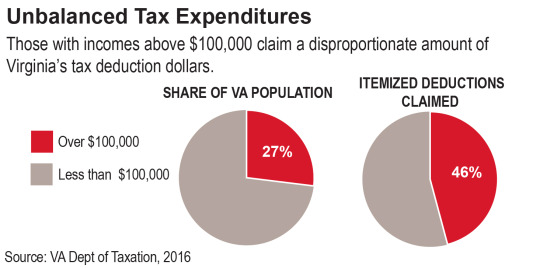
Effects of Tax Expenditures on Virginia
The state of Virginia provides nearly 200 tax preferences. In tax year 2014, Virginians in households with income of $100,000 and over claimed almost $20 billion in itemized deductions. This resulted in an approximate $1 billion loss to Virginia’s general fund, money that could otherwise have been used to increase access to health care and improve public schools for Virginia families.
A report released by the state Joint Legislative Audit and Review Commission in 2012 reviewed 20 tax preferences intended to provide financial assistance to taxpayers, 12 of which are targeted at benefiting lower income individuals. Of those 12, according to JLARC, 10 do the opposite, providing most of their benefit to higher-income individuals. For example, only one-third of the $30 million in reduced tax liability from the child and dependent care expenses deduction went to families making less than $50,000; while a larger share went to those making over $100,000.
Moving Forward
Tax preferences and loopholes divert revenue from local, state and federal budgets – and they can continue indefinitely without much scrutiny. Many of these tax breaks overwhelmingly benefit the wealthy, but public services that assist lower-income families are constantly on the chopping block for their assumed waste.
As we move forward to proposed tax reform and budgets – both state and federal – an equal level of scrutiny ought to be applied both to tax breaks and to how we choose to invest in communities. Creating thriving communities requires eliminating wasteful spending, making strategic investments, collecting sufficient resources, and ensuring everyone pitches in their fair share. If lawmakers are serious about making government more efficient and targeting the resources where they are needed most, it’s crucial to look bottom to top.
Category:
Budget & Revenue