June 29, 2016
Out of Touch: Incomes Rise for Virginia’s Top 0.1 Percent, Fall for Other 99.9 Percent
The top one tenth of 1 percent of households in Virginia had sharply higher incomes in 2013 than at the the end of the recession in 2009, while the average incomes of everyone else fell after adjusting for inflation.
The average income for the 4,200 households in that top sliver was almost $4 million in 2013, up 34 percent from 2009 after adjusting for inflation. By comparison, the average income for the bottom 99 percent of tax-filing Virginia families was $55,743, down 6 percent from 2009. Average incomes fell from 2009 to 2013 even for the merely wealthy – those in the top 1 percent of Virginia households but not in the top 0.1 percent, with incomes between $406,400 and $1,546,900 a year.
That’s worse than in the country as a whole, where income grew faster for the top 1 percent, but the average incomes of the other 99 percent at least grew some, according to a new report by the Economic Policy Institute.
Looking over the longer term – all the way back to 1979 – both high-income and more typical households in Virginia have seen real income growth. Virginia outpaced both the South and the United States as a whole, and overall, average real incomes have grown 30 percent in Virginia. That’s a good thing.
Unfortunately, though, even over that longer term, the highest-income households have seen faster income growth than other Virginia households
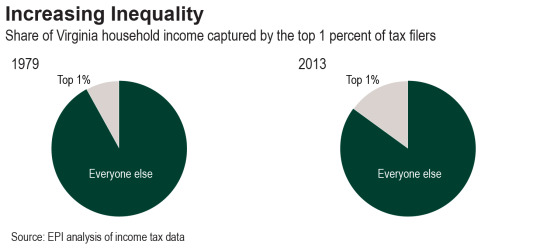
as wages for those at the top have soared compared to everyone else. As a result, the top 1 percent of Virginia households now command 15 percent of all Virginia household income, up sharply from 8 percent in 1979. And the top 0.1 percent – those making over $1,546,900 a year – now have 6 percent of all Virginia household income, up from 2.5 percent.
And within some of Virginia’s cities and counties the differences are even more striking. The City of Richmond is the 34th most unequal county or county-equivalent in the United States, with the top 1 percent having an average income of $1.5 million, over 40 times the average income of the other 99 percent of tax filers. Goochland County, 48th out of the 3,064 localities, and the City of Charlottesville, ranked 49th, aren’t far behind in terms of inequality.
If income had grown at the same rate for typical Virginia households as for the highest income ones since 1979, most folks would have seen a big difference. The average income for the “bottom” 99 percent of Virginia tax-filing households would have been $60,474 in 2013, about $4,700 more than they actually saw that year. That’s money that could have been used to pay the mortgage, save for college or retirement, or even spend at a local restaurant or clothing store.
It hasn’t always been this way. Between 1928 and 1979, incomes in Virginia and in the United States as a whole became more equal, with the share of all household income held by the top 1 percent declining. By contrast, since 1979, the top 1 percent’s share of all household income has increased in every state. Both eras were periods of rapid technological change that improved productivity, but during the earlier era there was also widespread collective bargaining, frequent improvements in the minimum wage, generally declining levels of unemployment, and a cultural environment that discouraged huge bonuses and outsized salaries for corporate executives. Increasing the share of income brought home by ordinary workers compared to those at the top affects the everyday life of almost everyone. It also promotes spending and saving, boosting the economy in the present and the future.
Virginia’s lawmakers can and should make policy choices that increase the bargaining power of workers and build an economy that works for all. To pretend that it is impossible to do so is to ignore history.
Category:
Economic Opportunity
